
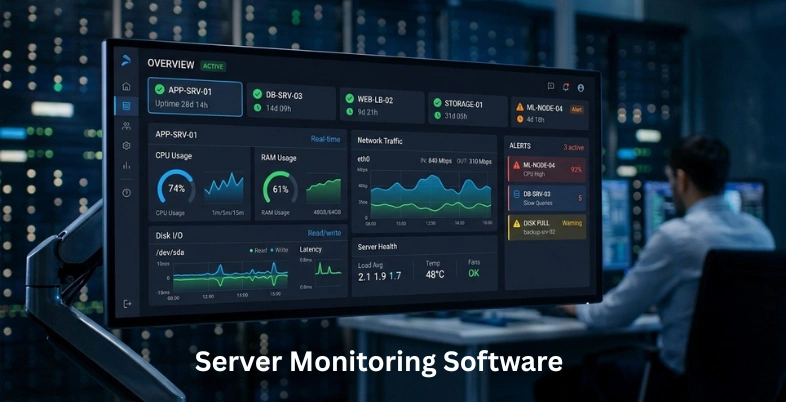
Server monitoring software plays a crucial role in ensuring the performance, security, and reliability of IT infrastructure. As businesses increasingly rely on digital systems, monitoring servers in real time becomes essential to detect issues, prevent downtime, and maintain smooth operations. These tools provide insights into server health, resource usage, network activity, and potential vulnerabilities.
They also offer alerts, reporting, and automation features to help IT teams respond quickly to problems. With a wide range of solutions available, choosing the right server monitoring tools, often integrated with network security tools, can significantly improve efficiency, reduce risks, and support consistent system performance across organizations.
Why Server Monitoring Is Critical for Modern IT Infrastructure
- Ensures System Uptime: Server monitoring helps maintain consistent uptime by detecting issues early and preventing unexpected outages that impact business operations
- Improves Performance Efficiency: It tracks resource usage like CPU, memory, and bandwidth, helping optimize performance and avoid system slowdowns or bottlenecks
- Enhances Security Monitoring: Monitoring tools detect unusual activities, vulnerabilities, and threats, enabling faster response to potential security breaches and risks
- Supports Proactive Issue Resolution: It allows IT teams to identify and resolve problems before they escalate into major failures or costly downtime incidents
- Optimises Resource Utilisation: Server monitoring ensures efficient allocation of resources, preventing overuse or underutilisation while improving overall infrastructure performance consistently
- Facilitates Better Decision-Making: Detailed insights and reports help businesses make informed decisions regarding upgrades, scaling, and infrastructure improvements effectively
- Ensures Compliance and Reliability: Monitoring supports regulatory compliance by maintaining logs and ensuring systems meet required standards for reliability and performance consistently
Common Challenges in Server Management and Monitoring
- Handling Large Data Volumes: Managing massive server data makes monitoring complex, requiring efficient tools to process information accurately
- Identifying Performance Bottlenecks: Detecting exact causes of slow performance can be difficult due to multiple interconnected system components
- Managing Multiple Servers: Monitoring numerous servers across environments increases complexity and requires centralised control for better management
- Ensuring Real-Time Monitoring: Achieving real-time insights is challenging due to delays in data collection and processing systems
- Dealing with Alert Fatigue: Excessive alerts can overwhelm teams, making it harder to identify and prioritise critical issues
- Maintaining Security Standards: Protecting servers from threats requires constant monitoring, updates, and proactive security management efforts
- Scalability and Resource Allocation: Scaling infrastructure while maintaining performance and allocating resources efficiently remains a significant ongoing challenge
Comparison Table
| Software | Deployment Type | Server Metrics Monitoring | API & Automation Support | Pricing |
| Nagios | On-Premise | CPU, memory, disk, network, processes | Yes – supports plugins and custom automation workflows | Free and subscription-based |
| Zabbix | On-Premise, Hybrid | CPU, memory, disk, network, processes | Yes – strong API and automation features | Free, paid support available |
| Datadog | Cloud-based | CPU, memory, disk, network, processes | Yes – extensive API integrations and automation | Subscription-based |
| Prometheus | On-premise, cloud-native | CPU, memory, disk, network, processes | Yes – API and integration with automation tools | Free |
| Grafana | Cloud-based, On-Premise, Hybrid | Depends on data sources (supports all major metrics) | Yes – API access and automation integrations | Free, Subscription-based |
| New Relic | Cloud-based | CPU, memory, disk, network, processes | Yes – strong automation and API ecosystem | Free tier, subscription-based |
| SolarWinds Server & Application Monitor | On-Premise, Hybrid | CPU, memory, disk, network, processes | Yes – automation and integration support | Subscription-based |
| Auvik | Cloud-based | CPU, memory, network, limited server metrics focus | Yes – API and automation capabilities | Subscription-based |
| ManageEngine OpManager | On-Premise, Cloud, Hybrid | CPU, memory, disk, network, processes | Yes – REST APIs and automation workflows | Free, subscription-based |
| Dynatrace | Cloud-based, Hybrid | CPU, memory, disk, network, processes | Yes – AI-driven automation and APIs | Subscription-based |
| Icinga | On-Premise, Hybrid | CPU, memory, disk, network, processes | Yes – strong plugin-based automation | Free (open-source), paid enterprise options |
| LogicMonitor | Cloud-based | CPU, memory, disk, network, processes | Yes – automation and API integrations | Subscription-based |
| Site24×7 | Cloud-based | CPU, memory, disk, network, processes | Yes – API and automation support | Subscription-based |
| Netdata | On-Premise, Cloud, Hybrid | CPU, memory, disk, network, processes | Yes – APIs and automation integrations | Free, subscription-based |
| Sematext Monitoring | Cloud-based, Hybrid | CPU, memory, disk, network, processes | Yes – API-driven automation | Free, subscription-based |
List of 15 Best Server Monitoring Software
1. Nagios
Website: https://www.nagios.org
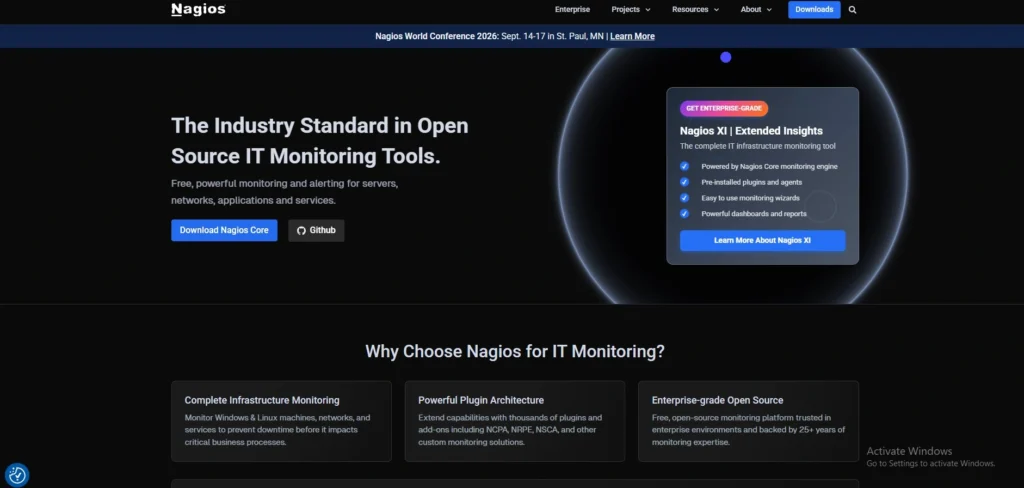
Nagios is an open-source server monitoring software that is widely used and assists organisations in monitoring the performance of the systems, uptime, and health of the infrastructures. It has both enterprise and core editions, and it can be used by small to large businesses.
Nagios also checks key metrics of a server like CPU load, memory, disk space and network activity. It is based on a plug-in architecture, where users can add functionality depending on their requirements.
Nagios can provide rapid detection and resolving of issues with alerting systems that can be sent through email or SMS. Its flexibility, community support and customisation capabilities make it a solid option to IT administrators dealing with complex server environments.
Key Features:
- Open-source server and infrastructure monitoring
- Monitors CPU, memory, disk, processes, and services
- Plugin-based extensibility for custom checks
- Alerting via email/SMS on threshold breaches
- Supports Windows, Linux, and Unix systems
Pros:
- Highly customizable with community plugins
- Strong monitoring for diverse environments
- Mature, widely adopted open-source tool
- Active community support
- Flexible alerting and reporting
Cons:
- Steeper learning curve for beginners
- Manual configuration can be time-consuming
- UI feels dated compared to modern tools
Pricing:
- Free- free
- Standard- Contact Sales
- Enterprise- Custom Pricing
2. Zabbix
Website: https://www.zabbix.com
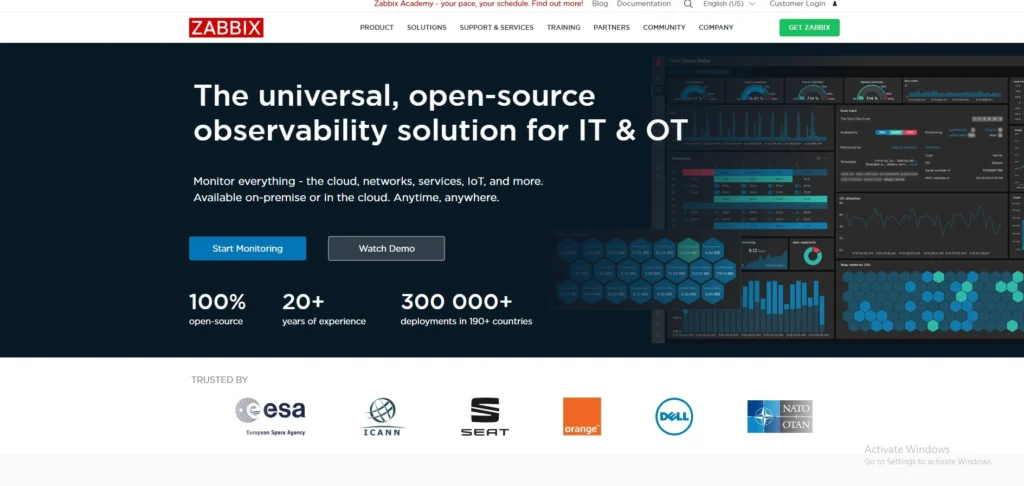
Zabbix is an open-source monitoring tool that is enterprise-level and is used to monitor server-performance and network infrastructure. It offers real time monitoring of CPU, memory, disk usage, and network traffic in a variety of systems.
Zabbix can be distributed, enabling support of large environments. It has a web-based interface to provide dashboards, graphs, and reporting capabilities. The platform contains alerting, automation and API integration of sophisticated workflows.
Zabbix is very customisable and agent-based and agentless monitoring. Its robust functionality, and the fact that it is free of the licensing fee make it a favorite among organisations that want a powerful and affordable server monitoring solution.
Key Features:
- Enterprise-class open-source monitoring
- Tracks CPU, memory, disk, network, and logs
- Agent and agentless monitoring support
- Dynamic thresholds and predictive alerts
- Web-based dashboards and reporting
Pros:
- Powerful, flexible open-source solution
- Monitors physical, virtual, and cloud servers
- Extensive alerting options
- Scales to large infrastructures
- Strong visualisation and baseline analytics
Cons:
- Setup and tuning can be complex
- Documentation can be overwhelming
- UI isn’t as modern as commercial tools
Pricing:
- Nano- Starting from $50
- Micro- Starting from $100
- Small- Starting from $250
- Medium- Starting from $750
- Large- Starting from $1875
- xLarge- Starting from $2500
- 2xLarge- Starting from $5000
3. Datadog
Website: https://www.datadoghq.com
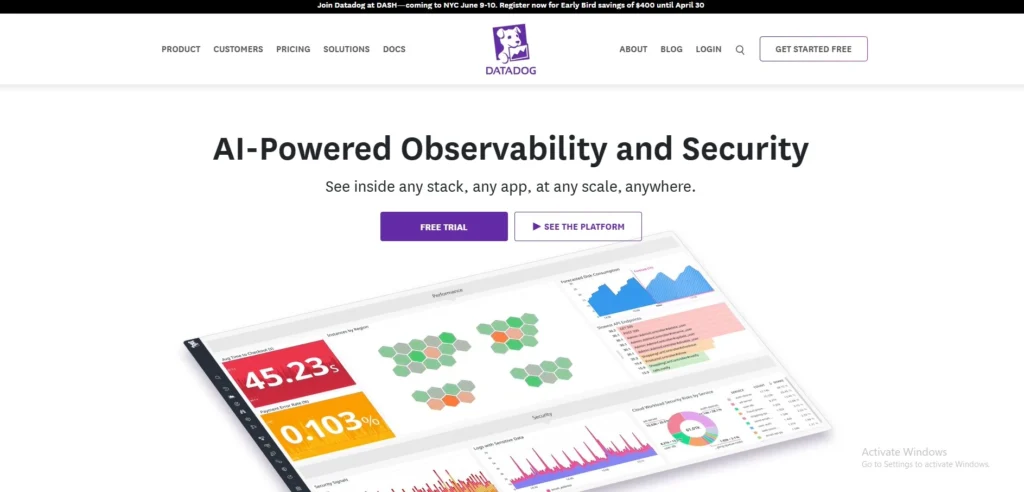
Datadog is a monitoring and analytics service, which is a cloud-based platform that offers a complete view of servers, applications, and infrastructure as a server monitoring software. It promotes real-time CPU, memory, disk, and network monitoring.
Datadog can be easily connected to different cloud services, containers, and databases and is thus suitable to the contemporary hybrid and cloud-native world. It provides dashboards, alerting, and AI-driven anomaly detection to detect problems fast.
Datadog also makes it simple to monitor large scale, with a user friendly interface and plenty of integrations. Its analytics and automation can allow teams to proactively manage performance and reliability of systems across distributed systems.
Key Features:
- Cloud-native monitoring and analytics
- Real-time server, network, and app metrics
- Over 850 integrations and dashboards
- Custom alerts and anomaly detection
- Log management and APM integration
Pros:
- Unified view of servers and apps
- Excellent visualization and integrations
- Auto-discovery of infrastructure
- Scales well for hybrid/cloud environments
- Strong automation and APIs
Cons:
- Subscription pricing can be high
- Can feel complex for small teams
- Advanced features require learning time
Pricing:
- Free- $0
- Pro- $15 Per host, per month
- Enterprise- $23 Per host, per month
- DevSecOps Pro- $22 Per host, per month
- DevSecOps Premium- $34 Per host, per month
4. Prometheus
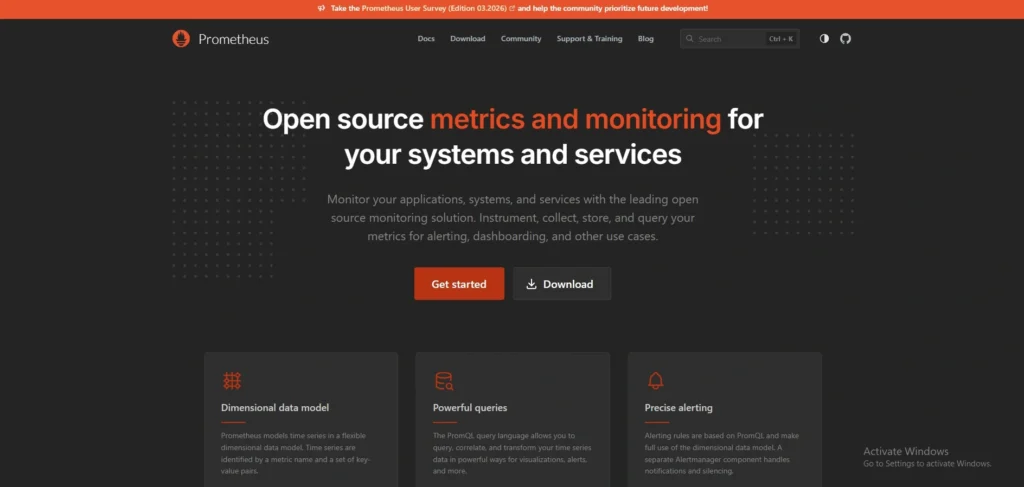
Website: https://prometheus.io
Prometheus is an open-source monitoring and alerting framework, which is mainly cloud-native. It collects and stores metrics as time-series data, allowing detailed analysis of server performance, including CPU, memory, disk, and network usage.
Prometheus is a pull-based scraper of metrics on configured targets and accepts potent querying with PromQL. It is compatible with microservices and Kubernetes architecture.
Notification can be set up with Alertmanager. Although it needs configuration and setup, prometheus is very flexible and scalable and is a favorite among DevOps teams dealing with dynamic and containerised infrastructures.
Key Features:
- Open-source time-series monitoring toolkit
- Pull-based metric collection model
- Powerful query language (PromQL)
- Works well with cloud and container environments
- Integrated Alertmanager for notifications
Pros:
- Designed for dynamic and scalable environments
- Excellent for Kubernetes and microservices
- Highly customisable metric collection
- Strong community and ecosystem
- Free and open source
Cons:
- Requires setup and configuration
- Not a full visualisation tool on its own
- Best with Grafana for dashboards
Pricing:
- Request Pricing
5. Grafana

Website: https://grafana.com
Grafana is a widespread open-source tool of visualisation and monitoring that is compatible with various data sources, such as Prometheus, InfluxDB, and others.
It enables users to develop interactive dashboards to display server metrics like CPU, memory, disk usage and network activity. Grafana is not a data-gathering tool but is concerned with the presentation of data in a relevant way. It helps in alerting, templating and extra-functionality plugins, which can complement cyber security services
Grafana Cloud is available as managed services. It is a powerful tool to monitor and analyse the performance of servers and infrastructure because of its flexibility, rich visualisations, and integration facilities.
Key Features:
- Visualisation platform for metrics and logs
- Supports Prometheus, InfluxDB, and others
- Custom dashboards and alerts
- Plugin ecosystem for extended integrations
- Grafana Cloud available for hosted use
Pros:
- Beautiful and customisable dashboards
- Works with many data sources
- Strong alerting and templating
- Scales from small to enterprise
- Active open-source community
Cons:
- Doesn’t collect metrics itself
- Requires backend data source setup
- Some advanced features need paid plan
Pricing:
- Free- $0
- Pro- $19/month + usage
- Enterprise- $25,000/year spend commit
6. New Relic

Website: https://newrelic.com
New Relic is an observability platform, based on the cloud, which offers all-inclusive monitoring of servers, applications, and infrastructure. It provides real time information on the use of CPU, memory, disk performance and network activity.
New Relic provides APM, logs, and distributed tracing functionality, enabling teams to know the behavior of systems end-to-end. Its artificial intelligence-based analytics helps to identify anomalies and ensure performance optimization. The platform consists of dashboards, alerts, and connections with well-known tools and services.
New Relic has an easy-to-use interface and a scalable architecture that fits companies of any size looking to gain an in-depth insight into their server environments and application performance.
Key Features:
- Full-stack observability platform
- Server, app, and infrastructure monitoring
- Real-time alerts and dashboards
- Deep APM and error tracing
- Integrates with DevOps toolchains
Pros:
- Unified monitoring across stack
- Excellent APM and alerting
- Cloud-native and hybrid support
- Strong integration ecosystem
- Scales for enterprise usage
Cons:
- Can be pricey at scale
- Learning curve for full feature set
- For new users, the UI can be overwhelming.
Pricing:
- Free- free
- Standard- Contact Sales
- Pro- Contact Sales
- Enterprise- Contact Sales
7. SolarWinds Server & Application Monitor
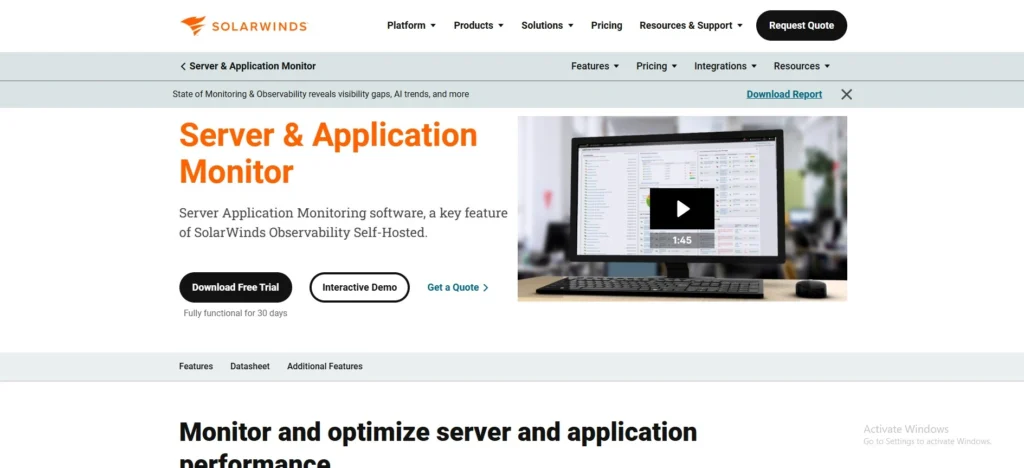
Website: https://www.solarwinds.com/server-application-monitor
SolarWinds Server & Application Monitor is an enterprise level monitoring tool that is used to monitor servers, applications, infrastructure elements, and integrates well with API security platforms to ensure secure API communications. It gives comprehensive information about CPU, memory, disk and network usage.
The tool accommodates physical and virtual environments, and provides insight into the health of the systems in a deep manner. It has automated discovery, alerting, customizable dashboards, and efficient monitoring. SolarWinds also offers reporting and performance baselines to monitor time trends.
Its easy-to-use interface and monitoring features have made it appropriate in IT teams that are dealing with complex environments and demand reliable and centralised server monitoring.
Key Features:
- End-to-end server and app monitoring
- Tracks CPU, memory, storage, and network
- Application dependency mapping
- Customisable dashboards and alerts
- Supports hybrid and cloud environments
Pros:
- Comprehensive visibility for servers and apps
- Strong capacity planning tools
- Integrates with broader SolarWinds suite
- Suitable for large IT environments
- Detailed performance analytics
Cons:
- Licensing cost can be high
- Setup and configuration can be lengthy
- UI is feature-rich but complex
Pricing:
- Monitoring & Observability- $7 Per Node/Month
- Database- $142 Per Database/Month
- IT Service Management- $39 Per technician/month
- Incident Response- $15 Per user/month
8. Auvik
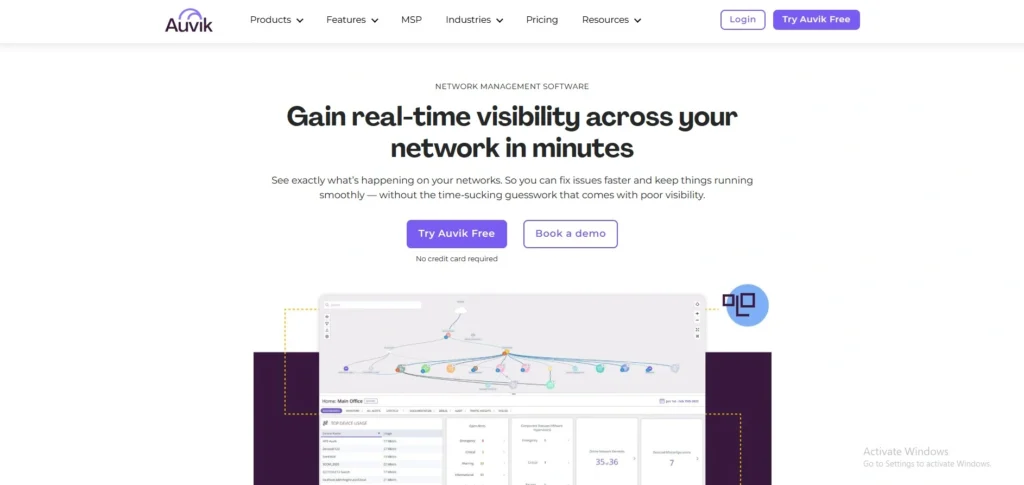
Website: https://www.auvik.com
Auvik is a network and server monitoring software platform which is a solution that is cloud-based and aims at simplifying the management of IT infrastructure. It offers automatic network discovery, real-time status, and visualisation of connections and devices.
Auvik tracks key server and network metrics such as performance, traffic, and uptime. Its topology mapping provides a clear infrastructure relationship. There is also the alerting, reporting and configuration backup in Auvik. It simplifies deployment and maintenance burden with a SaaS-based model.
It is especially handy when managed service providers or IT teams require central visibility and effective monitoring of many client environments or locations.
Key Features:
- Cloud-based network and server monitoring
- Automated network discovery
- Real-time performance tracking
- Alerting on resource thresholds
- Inventory and device insights
Pros:
- Easy cloud deployment
- Strong network topology visualization
- Useful for MSPs and distributed sites
- Automated alerts and insights
- Reduces manual monitoring overhead
Cons:
- Focus is more network-centric
- Some users report mapping limitations
- Subscription pricing
Pricing:
- Get your custom pricing
9. ManageEngine OpManager
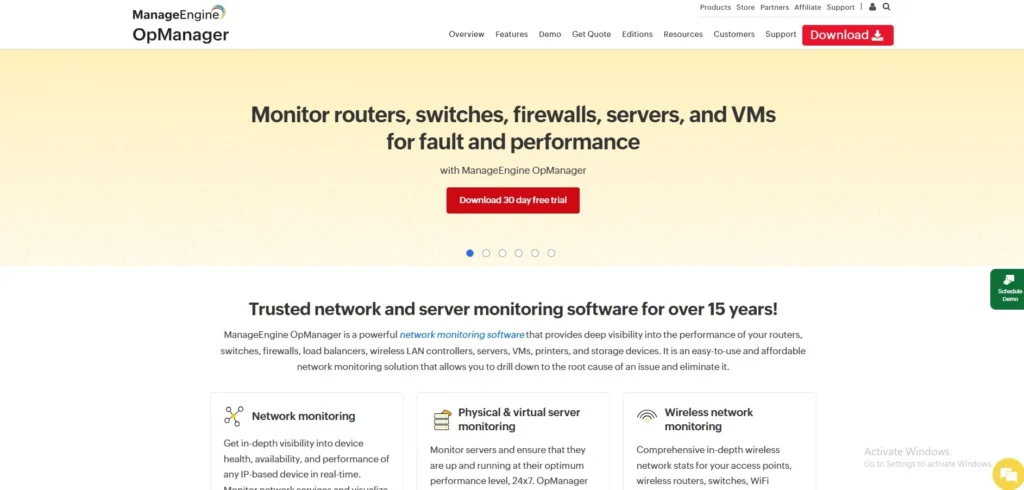
Website: https://www.manageengine.com/opmanager
ManageEngine OpManager is an all-inclusive network and server monitoring software that provides real-time view of IT infrastructure. It monitors the performance of CPU, memory, disk, and network of physical and virtual servers.
The platform has automated system health monitoring dashboards, threshold-based alerts, and automated system health discovery. OpManager is the one that automates workflow and is integrated with other ManageEngine products to do that.
It also offers performance reports and analytics in order to determine bottlenecks and optimise resources. Having flexible deployment and being user friendly, OpManager fits well into the companies who want a single solution to monitor their servers and network.
Key Features:
- Unified network and server monitoring
- Real-time performance dashboards
- Threshold alerts and workflows
- Automated device discovery
- Reports and analytics
Pros:
- Good balance of features and cost
- Monitors large metric sets
- Intuitive interface
- Suitable for hybrid environments
- Affordable pricing tiers
Cons:
- Lacks advanced AI automation
- Integration depth lower than premium tools
- Manual setup for legacy devices
Pricing:
- Request a Pricing Quote
10. Dynatrace
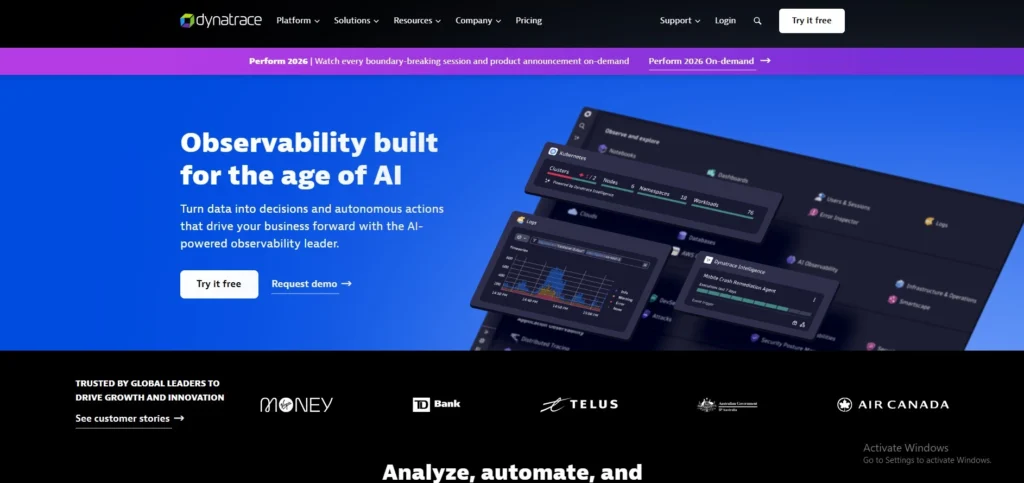
Website: https://www.dynatrace.com
Dynatrace is an AI-based observability solution that provides high-end server and application monitoring, making it one of the advanced server monitoring tools. It automatically identifies infrastructure resources and gives live data on CPU, memory, disk, and network performance.
Dynatrace applies artificial intelligence to identify anomalies, root causes, and remediation actions. It favors on-premise, cloud, and hybrid environments hence highly scalable. The platform contains full-stack monitoring, application performance monitoring, and digital experience analytics.
Its automation and AI-driven approach reduce manual effort while improving accuracy. Dynatrace is best suited to companies that need extensive visibility and smart monitoring of complex and distributed systems.
Key Features:
- AI-driven observability and monitoring
- Automatic infrastructure discovery
- Deep process-level metrics
- Full-stack tracing and analytics
- Supports hybrid and cloud stacks
Pros:
- Strong AI anomaly detection
- Auto-instrumentation and insights
- Excellent for complex systems
- Unified platform for infra and apps
- Scales well for large environments
Cons:
- Premium pricing model
- Steeper learning curve
- Advanced features may be overkill for small teams
Pricing:
- Foundation & Discovery- $7/month
- Infrastructure Monitoring- $29/month
- Full-Stack Monitoring- $58/month
11. Icinga
Website: https://icinga.com
Icinga is an open-source monitoring system that provides flexibility and scalability for keeping an eye on servers, networks, and applications. It monitors vital parameters of CPU, memory, disk space, and network performance. Icinga offers a web interface for dashboards, reporting, and alert management.
It provides support of distributed monitoring environments and is compatible with different plugins and extensions. The platform is highly customisable whereby users can adapt it to suit a given infrastructure requirement.
Icinga also provides automation and configuration management via API. Its open-source and good community support make it a good option to organisations that need flexibility and affordable monitoring.
Key Features:
- Open-source monitoring for infrastructure and apps
- Real-time metrics and alerting
- Custom workflows and APIs
- Dashboards and analytics
- Plugin and extension support
Pros:
- Highly flexible open-source tool
- Good for custom monitoring needs
- Strong API and automation support
- Scales across environments
- Community and commercial support available
Cons:
- Requires configuration effort
- Less polished UI than commercial tools
- Setup time can be significant
Pricing:
- Free- €0
- Repository Subscription- €5.000/year
- Modular Subscription- €2.000/year
- Support Subscription- €15.000/year
12. LogicMonitor
Website: https://www.logicmonitor.com
LogicMonitor is a server monitoring software platform that is based on the cloud and aimed at hybrid and multi-cloud environments, making it one of the efficient server monitoring tools. It does automatic discovery of infrastructure components and tracks server metrics such as CPU, memory, disk, and network usage.
LogicMonitor is an AI-based analytics that allows identifying anomalies and anticipating a problem that could adversely affect performance. It has customisable dashboards, alerts and reporting to enhance visibility. Several third-party applications and services can be integrated on the platform.
Its SaaS system does not require on-premise installation, which is fast and simple to deploy. LogicMonitor would fit in businesses that require scalable, automated, and intelligent server monitors.
Key Features:
- Cloud-based infrastructure monitoring
- AI-assisted anomaly detection
- Auto discovery of servers and devices
- Custom dashboards and alerts
- Broad integration support
Pros:
- Excellent hybrid/cloud support
- Strong automation and AI insights
- Scalable for enterprise use
- Rich integration ecosystem
- Intuitive dashboards
Cons:
- Pricing can be high
- Onboarding learning curve
- Advanced features in premium tiers
Pricing:
- Essential- $16 per hybrid unit
- Advanced- $27 per hybrid unit
- Signature + Edwin AI- $53 per hybrid unit
13. Site24x7
Website: https://www.site24x7.com
Site24x7 is a cloud-based system of monitoring which provides end-to-end monitoring of servers, applications and websites. It monitors the performance of CPU, memory, disk, and network.
The platform includes dashboards, performance reports, and alerts to keep the IT teams aware of the health of the systems, making it one of the reliable server monitoring software solutions. Site24x7 also allows multi-location monitoring, which allows visibility throughout the global infrastructure and is recognized as one of the effective server monitoring tools. It also has automation and DevOps integrations.
Its single monitoring strategy enables users to control servers, cloud resources and applications through one interface. Site24x7 is an affordable and convenient service that can be deployed by any business interested in reliable and scalable monitoring.
Key Features:
- Cloud-based server and infrastructure monitoring
- Multi-location performance tracking
- AI-powered alerts and anomaly detection
- Unified monitoring for apps and servers
- Dashboards and reports
Pros:
- Affordable SaaS model
- Easy to deploy and scale
- Broad IT and cloud visibility
- Useful for SMBs and MSPs
- Quick onboarding
Cons:
- UI can feel dated
- Advanced customisation may need support
- Pricing changes can affect licensing
Pricing:
- Lite- $9/month
- Professional- $42/month
- Enterprise- $625/month
14. Netdata
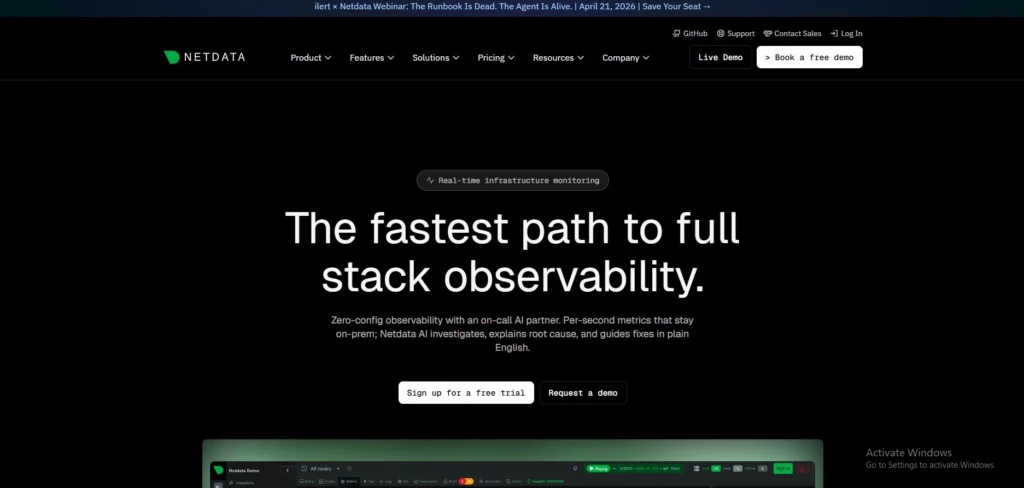
Website: https://www.netdata.cloud
Netdata is a performance monitoring system that is real-time and is aimed at high-resolution information of the server and system metrics. It gives you real-time access to CPU load, memory, disk, and network usage.
Netdata operates lightweight agents to gather metrics with little overhead and thus is efficient in terms of constant monitoring. The platform provides interactive dashboards with visualisation and anomaly detection features. It is compatible with cloud, on-premise and hybrid environments.
Netdata also has alerting capabilities and external integration. Its portability, in-the-moment analytics, and lightweight design make it a favorite among developers and system administrators.
Key Features:
- Real-time metrics at per-second granularity
- Distributed monitoring with ML insights
- Interactive dashboards and alerts
- 850+ integrations and data collectors
- Scalable open-source architecture
Pros:
- Extremely detailed real-time visibility
- Fast installation and low overhead
- Machine-learning anomaly detection
- Great for DevOps and SRE teams
- Open-source and cloud options
Cons:
- Best with external storage for long-term data
- May require learning for full power
- Visualisation can be overwhelming
Pricing:
- Community- Free
- Business- $4.50/node/month
- Enterprise On-Premise- Contact Sales
15. Sematext Monitoring
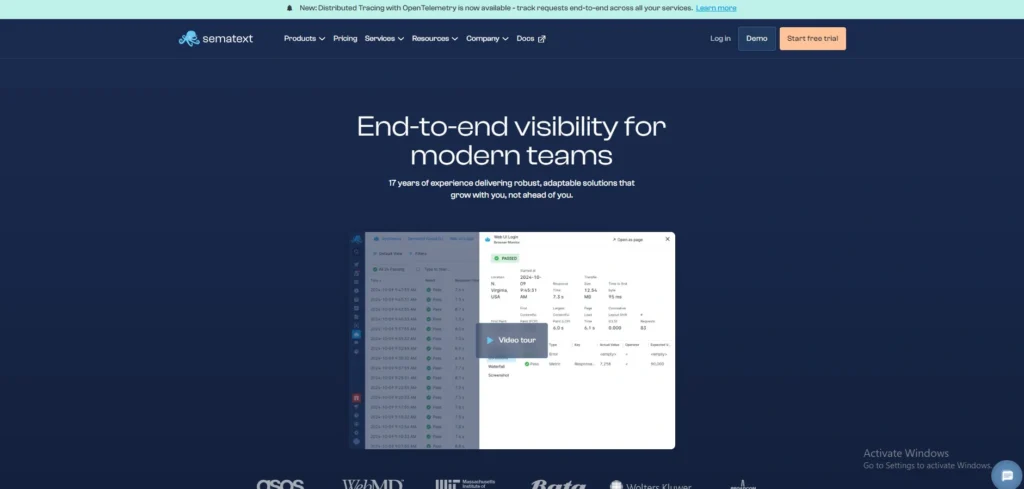
Website: https://sematext.com
Sematext monitoring is a cloud-based observability platform, which allows server, application, and infrastructure monitoring. It monitors CPU, memory, disk, and network performance in real time. The platform provides logs, alerts, and dashboards to have a complete visibility.
Sematext is compatible with distributed systems and cloud-native environments, and thus it is appropriate to the new IT infrastructure. It also includes anomaly detection and performance analytics to help identify issues early.
The centralised monitoring style of the system allows users to control logs, metrics, and events centrally. Sematext fits best when a team requires a complete monitoring tool with high observability capabilities.
Key Features:
- Unified infrastructure and app monitoring
- Auto-discovery and dashboards
- Alerts with anomaly detection
- Logs and metrics in one place
- Cloud-native and hybrid support
Pros:
- Centralised observability platform
- Quick setup with prebuilt dashboards
- Supports servers, containers, and cloud
- Integrated logs and metrics
- Scalable and flexible
Cons:
- Some features need subscription
- UI complexity for beginners
- Advanced analytics in higher tiers
Pricing:
- Logs- $5/month
- Infra Monitoring- $2.8/month
- Service Monitoring- $8.64/month
- Tracing- $19/month
- Network Map- $1.68/month
- Experience- $9/month
- Synthetics- $2 per monitor/month
Ending Thoughts
In conclusion, server monitoring software is essential for maintaining system stability, optimising performance, and preventing unexpected downtime. These tools provide real-time insights, alerts, and analytics that help IT teams quickly identify and resolve issues. By choosing the right solution, businesses can improve operational efficiency, enhance security, and ensure reliable service delivery.
Each software offers unique features, so the best choice depends on specific infrastructure needs and budget. Consistent monitoring and proactive management not only reduce risks but also support long-term growth, scalability, and seamless performance in today’s increasingly digital and data-driven business environment.
FAQs
Q1. What Is Server Monitoring Software?
Server monitoring software tracks server performance, uptime, and resource usage to ensure systems run efficiently and issues are detected early.
Q2. Why Is Server Monitoring Important?
It helps prevent downtime, improves performance, enhances security, and ensures smooth operations by identifying and resolving issues quickly.
Q3. What Features Should Server Monitoring Software Have?
Key features include real-time monitoring, alerts, performance analytics, uptime tracking, automation, and integration with other IT management tools.
Q4. How Does Server Monitoring Software Improve Business Performance?
Server monitoring software helps businesses maintain high system availability, reduce downtime, and optimize resource usage, leading to better productivity and user experience.
Q5. Is Server Monitoring Software Suitable For Small Businesses?
Yes, many server monitoring tools offer scalable and affordable plans, making them suitable for small businesses to monitor performance, prevent issues, and ensure reliable operations.